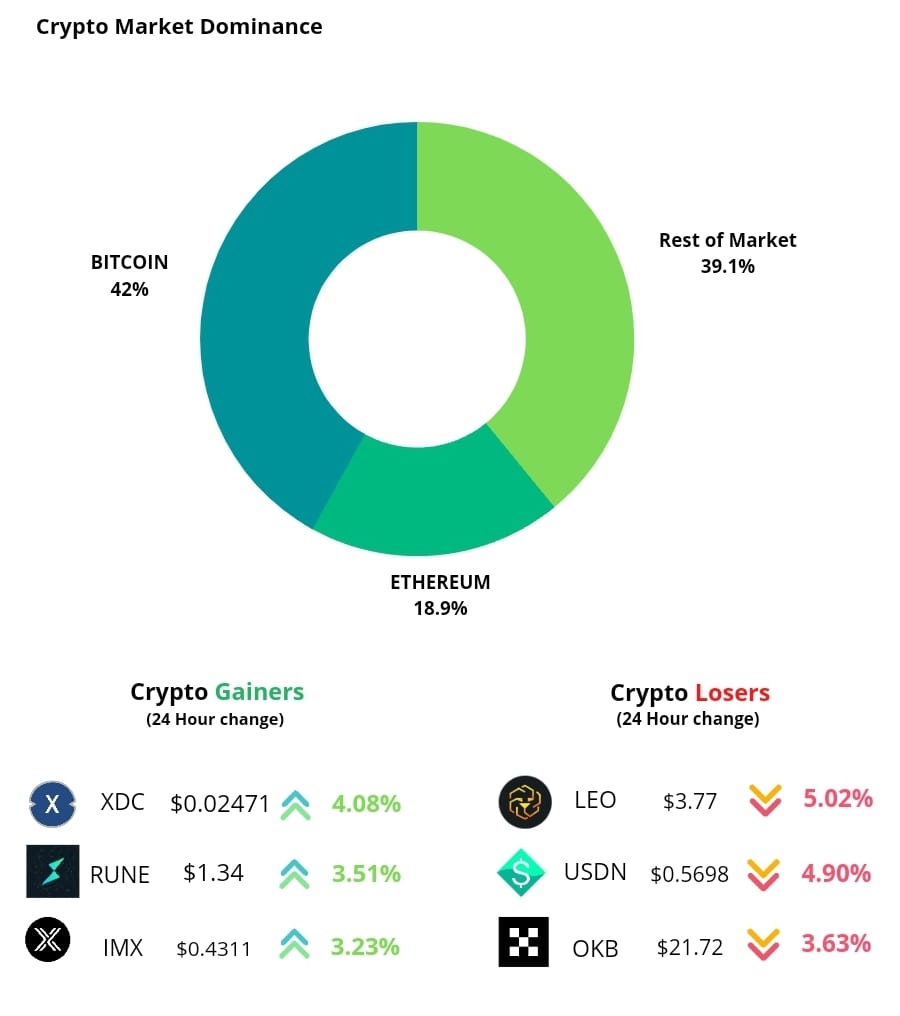
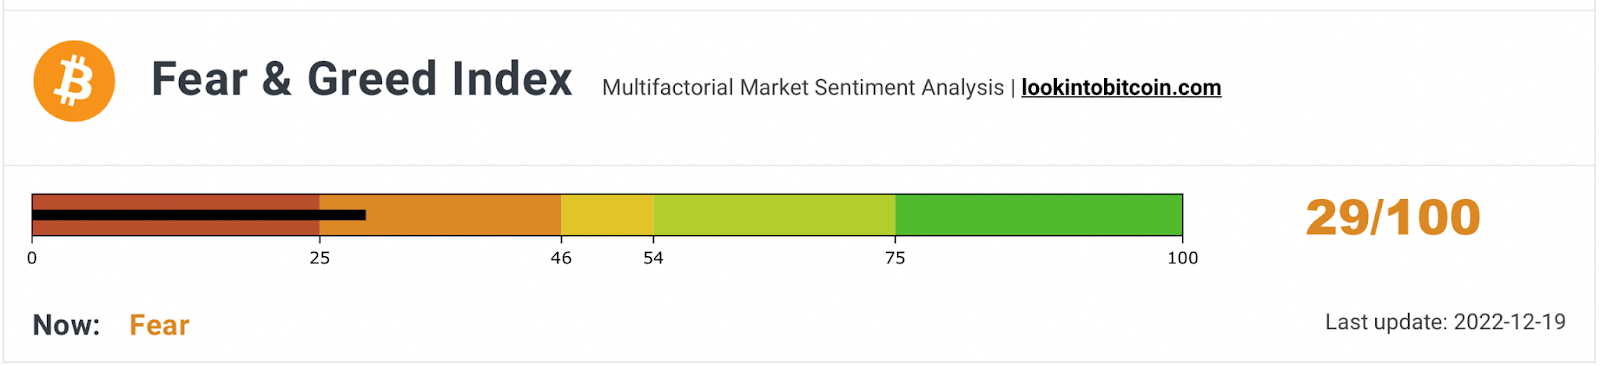
What is the general sentiment for Crypto?
The sentiment towards the cryptocurrency market is in the fear zone. Compared to last week’s, the Fear & Greed Index has changed from “27” to “29”.
SOPR
Another data to evaluate the sentiment of the general public would be to look at Spent Output Profit Ratio (SOPR). What is SOPR? In layman terms, it indicates if people have sold their BTC at a profit or if they sold at a loss. An SOPR value above 1 indicates that profit booking dominated loss booking and below 1 indicates that loss booking dominated profit booking. A value of 1 indicates that the coins were sold at their purchase price. Adjusted SOPR filters out transactions that are younger than 1 hour, thus, clearing out noise from the metric.
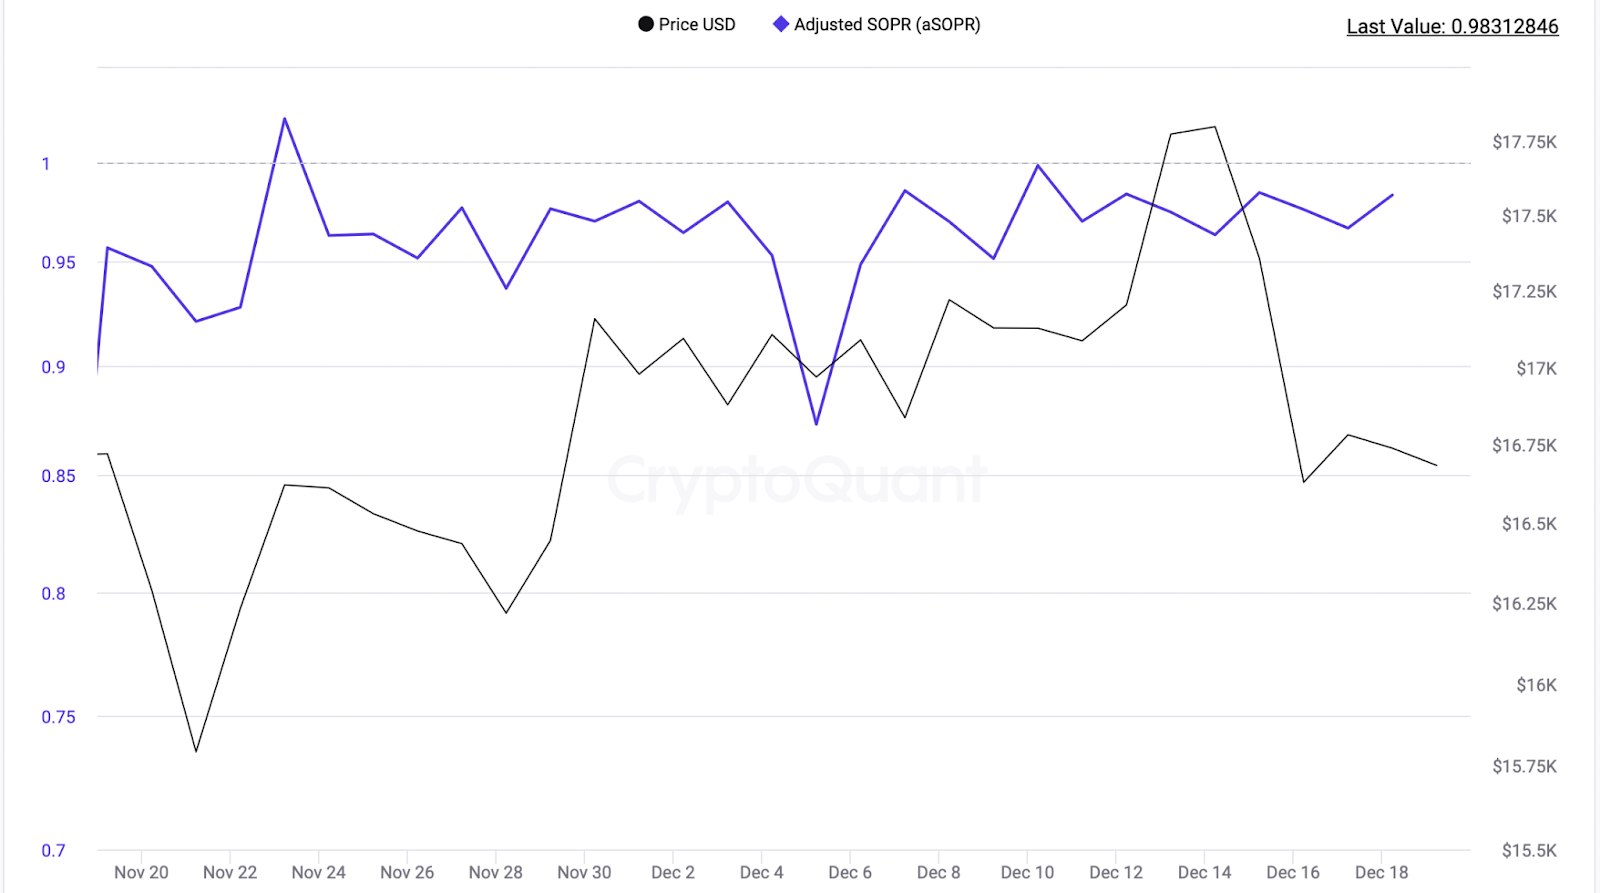
aSOPR for this week stands at 0.98 which means the coins on average are being sold near their purchase price

Is This The End of the Bear Market?
BITCOIN RAINBOW CHART INDICATOR
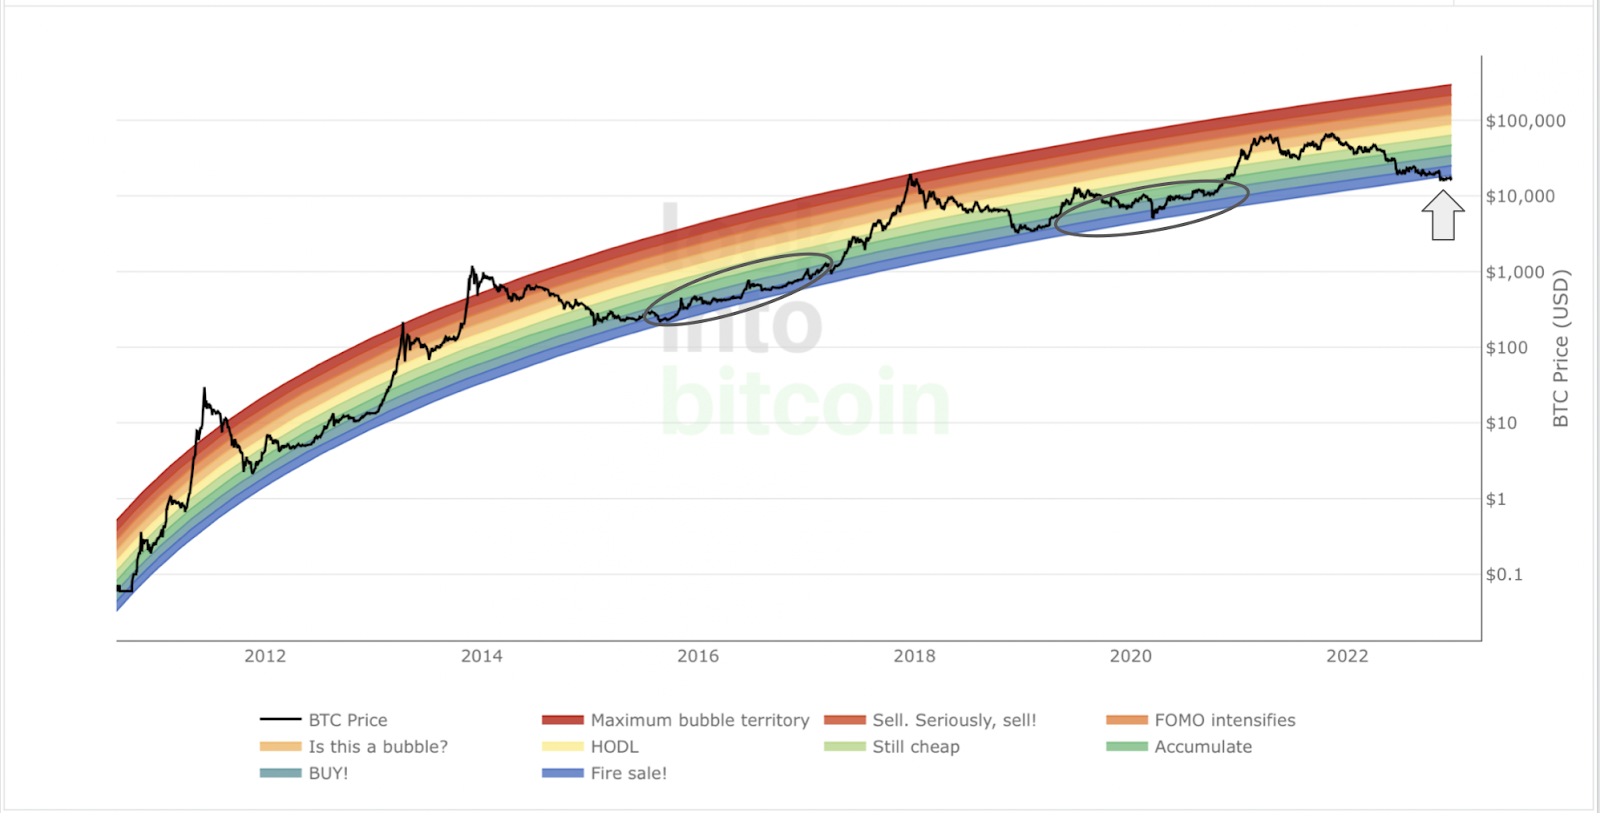
The Rainbow Chart is a long-term valuation tool for Bitcoin. It uses a logarithmic growth curve to forecast the potential future price direction of Bitcoin.
It overlays rainbow color bands on top of the logarithmic growth curve channel in an attempt to highlight market sentiment at each rainbow color stage as price moves through it. Therefore highlighting potential opportunities to buy or sell.
Historically the blue band indicated the bottom of the cycle, blue band which is also called as the fire sale period offers extraordinary rewards to the risk
REALIZED PRICE
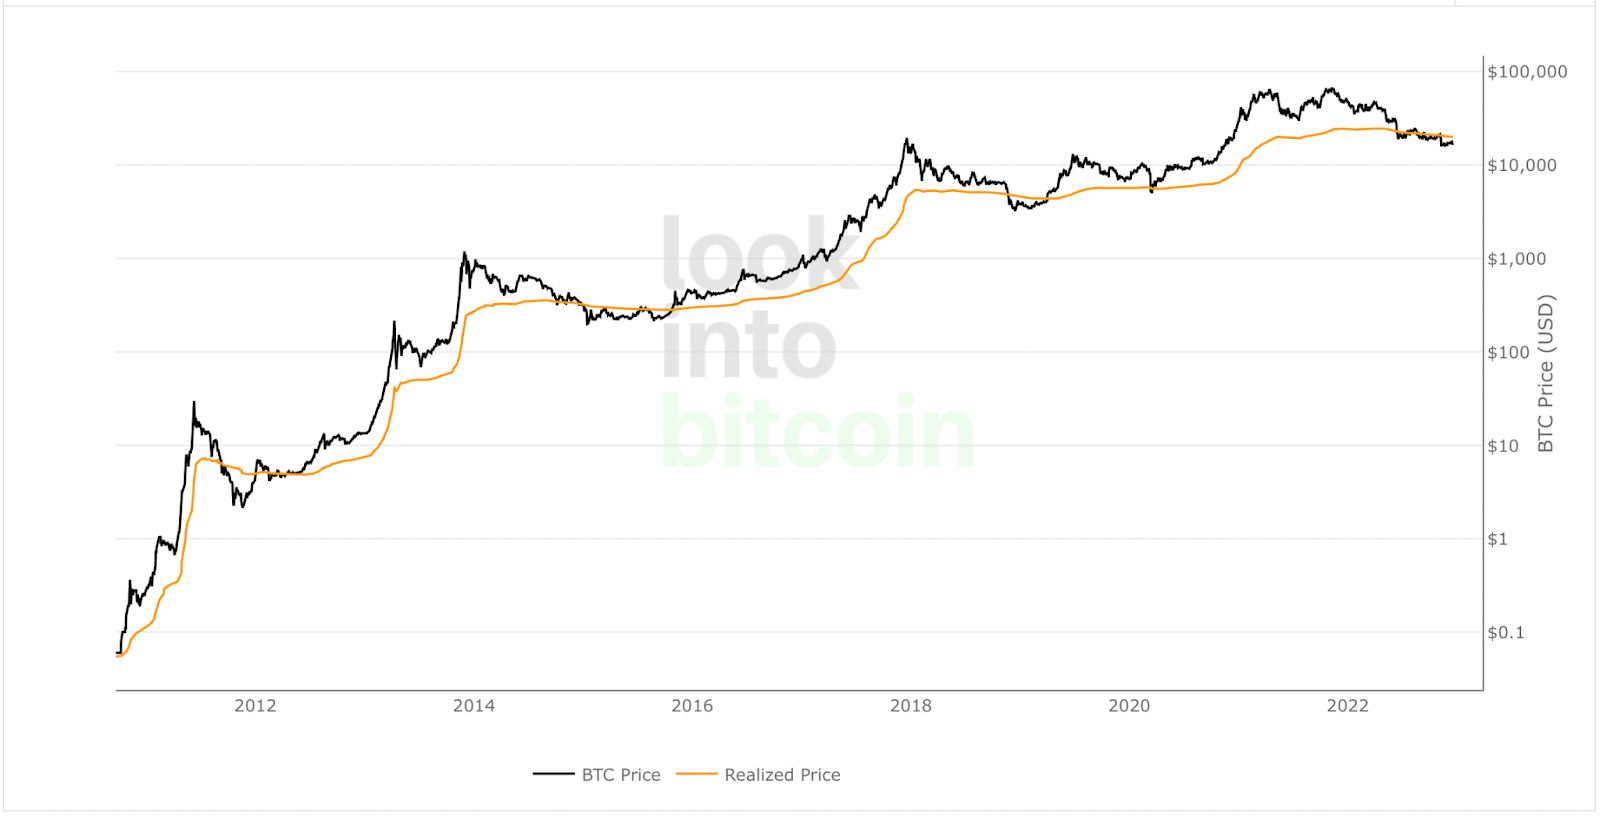
Realized price is defined as the average cost of acquisition based on every coin moved on-chain. In all the previous bear markets we see that the price trades below the realized price which indicates on average the coins held during this period have higher cost of acquisition than the current market price. Realized prices act as psychological support areas during bear markets.
The current price of Bitcoin is trading below the realized price of Bitcoin of 19,980 USD. For bull market confirmation, the market price of Bitcoin should be above realized price.
MVRV, Z-SCORE
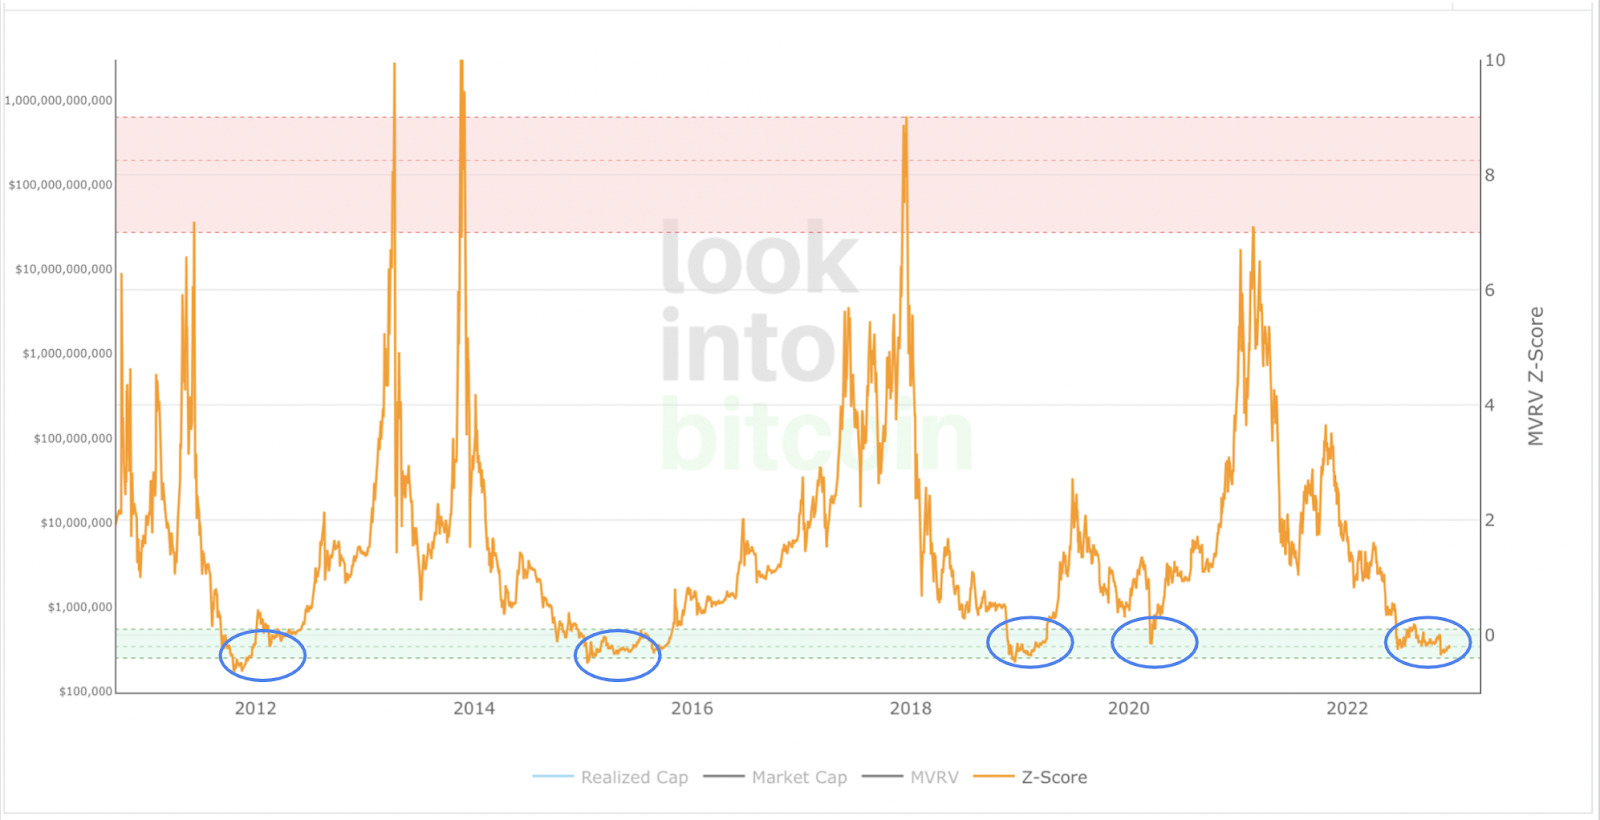
The MVRV, Z-score has historically been very effective in identifying periods where market value is moving unusually high above realized value. These periods are highlighted by the z-score (red line) entering the pink box and indicating the top of market cycles. It has been able to pick the market high of each cycle within two weeks.
It also shows when market value is far below realized value, highlighted by z-score entering the green box. Buying Bitcoin during these periods has historically produced outsized returns.
Overall Market Performance
Dow Jones
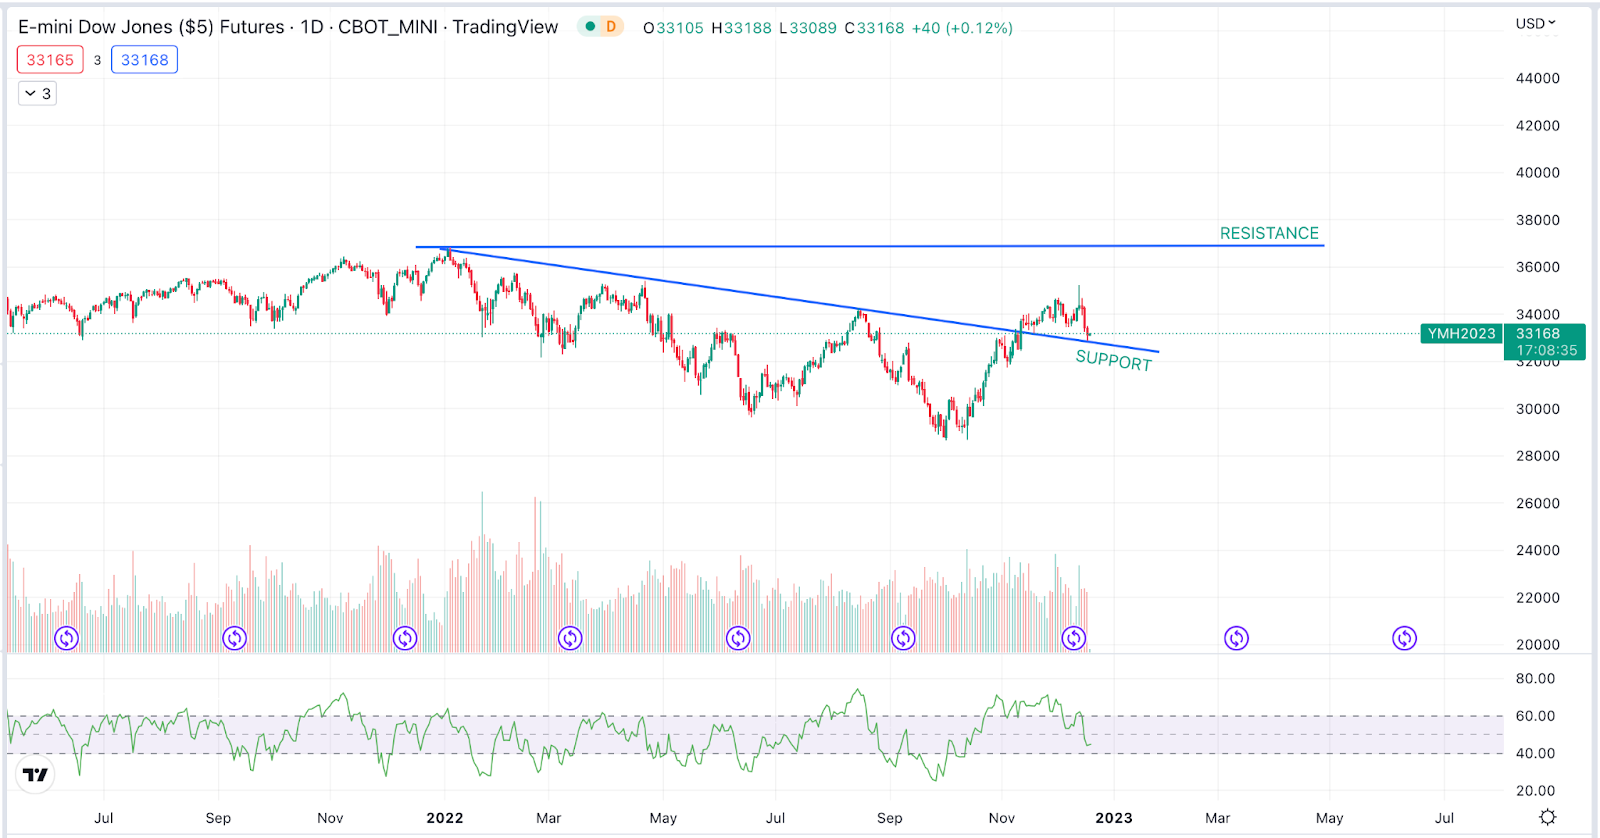
The Dow Jones Industrial Average corrected by 1.82% in the last week. The next resistance is expected at 37,000 and immediate support is expected at 33,000 levels.
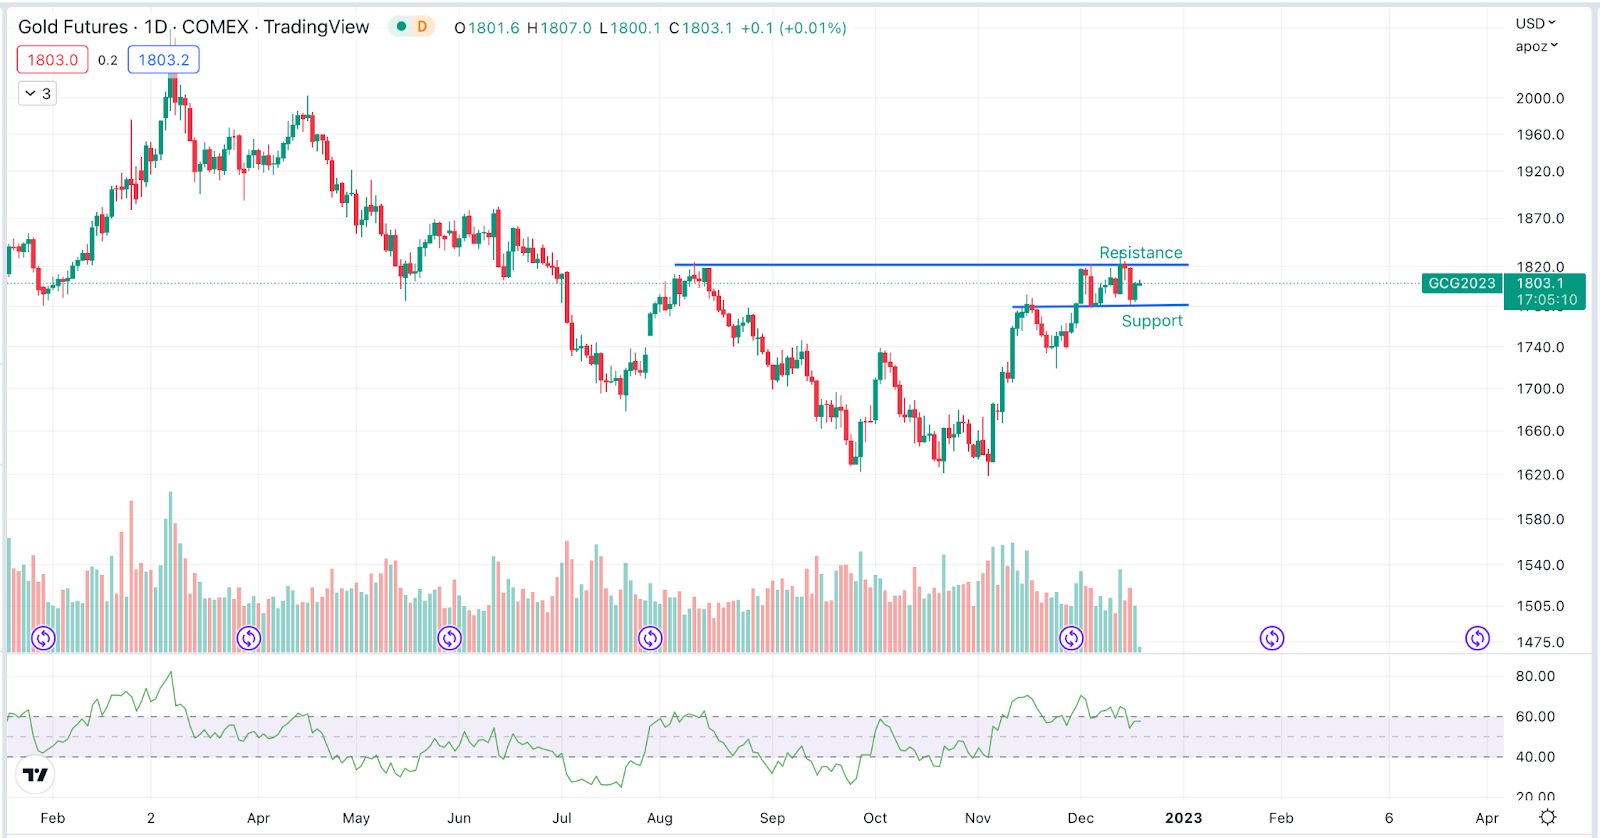
Gold
Bitcoin
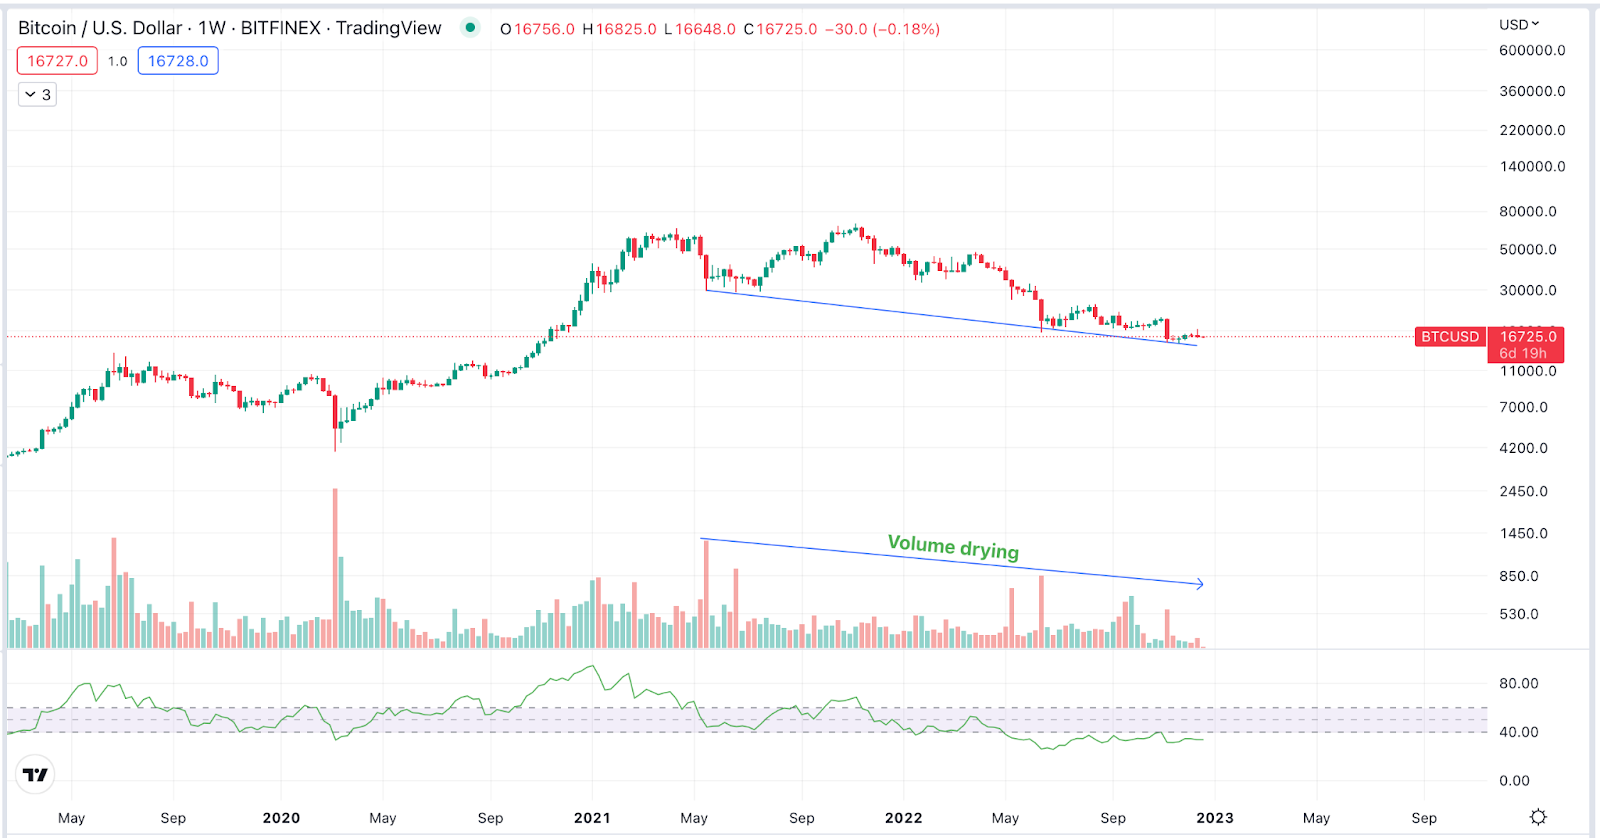
Bitcoin is trading at the support and volume is drying which is an indication of a big move. The next resistance is expected at $21,500 and support at $15,500
ETHEREUM
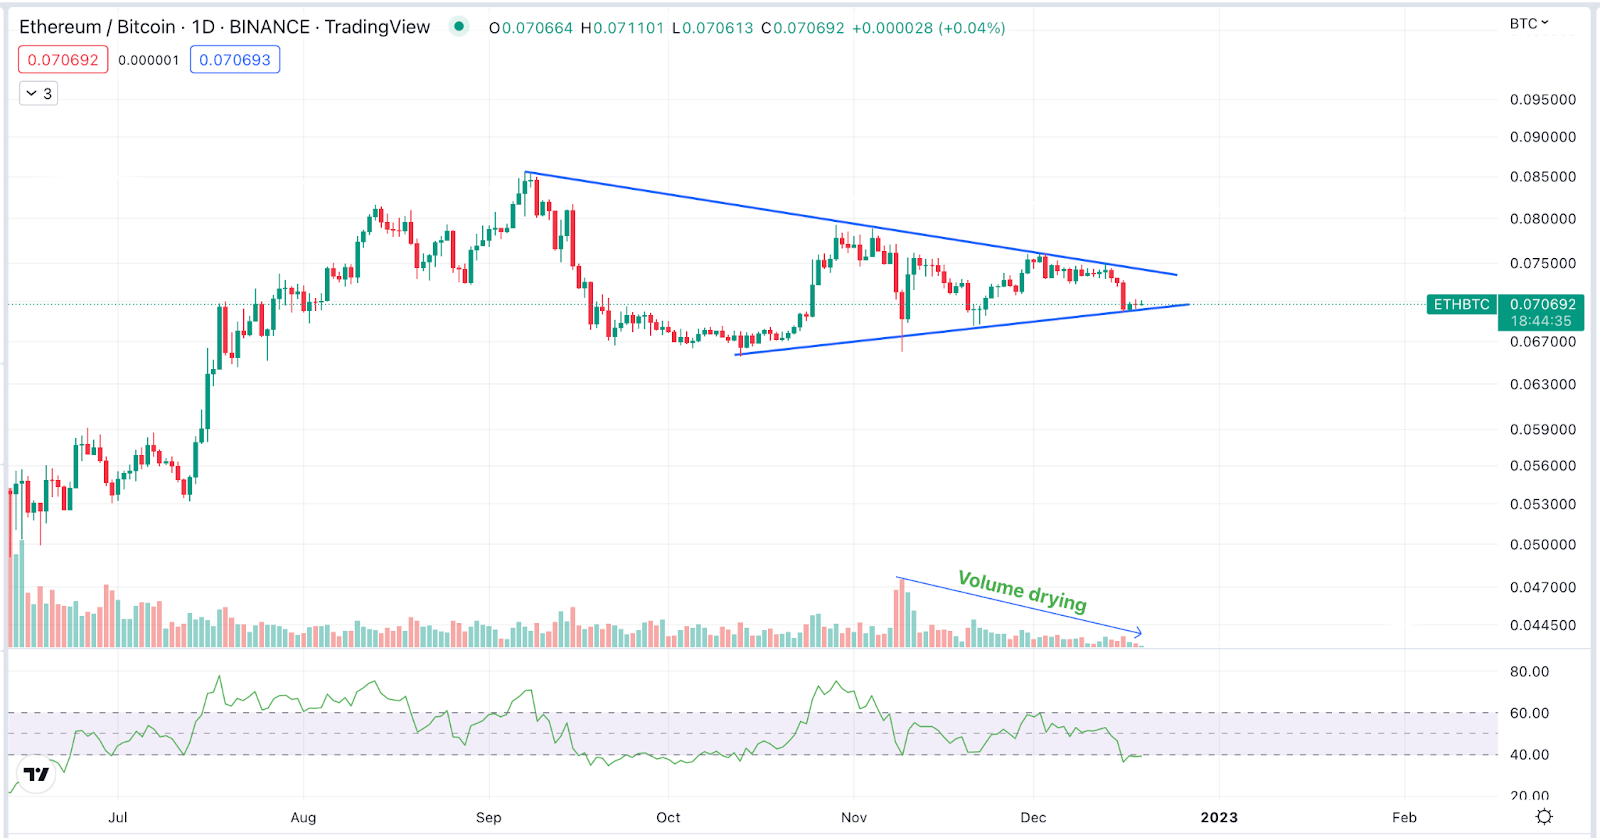
ETH/BTC is showing a volatility contraction pattern which is an indication of a big move. The next resistance is expected at 0.080 and next support is expected at 0.065.
Highlights of the week:

Goldman Sachs used a private blockchain to arrange a 100 million euro two-year digital bond for the European Investment Bank that was settled in 60 seconds instead of the usual five days.

Despite crypto winter, first-time and returning buyers per day in Polygon’s NFT market reached new all-time highs during the last month of the year.

Apple plans to enable the installation of apps from external sources outside of its own App Store on iPhones and iPads because of European Union’s Digital Markets Act, which requires tech companies to fully comply with restrictions by 2024.
Get deeper insights into the crypto market’s weekly trends discussed on our Spotify podcast. Start your Crypto Investments with XMINT Bots today