Relative Strength Index (RSI) : A Guide to Momentum Analysis
The Relative Strength Index (RSI) is a widely recognized momentum indicator in technical analysis, used to evaluate the speed and magnitude of price changes in securities. Developed by J. Welles Wilder Jr. and introduced in his 1978 book New Concepts in Technical Trading Systems, RSI has become an essential tool for traders and investors seeking to identify overbought or oversold conditions, potential reversals, and trend continuations.

What Is the RSI?
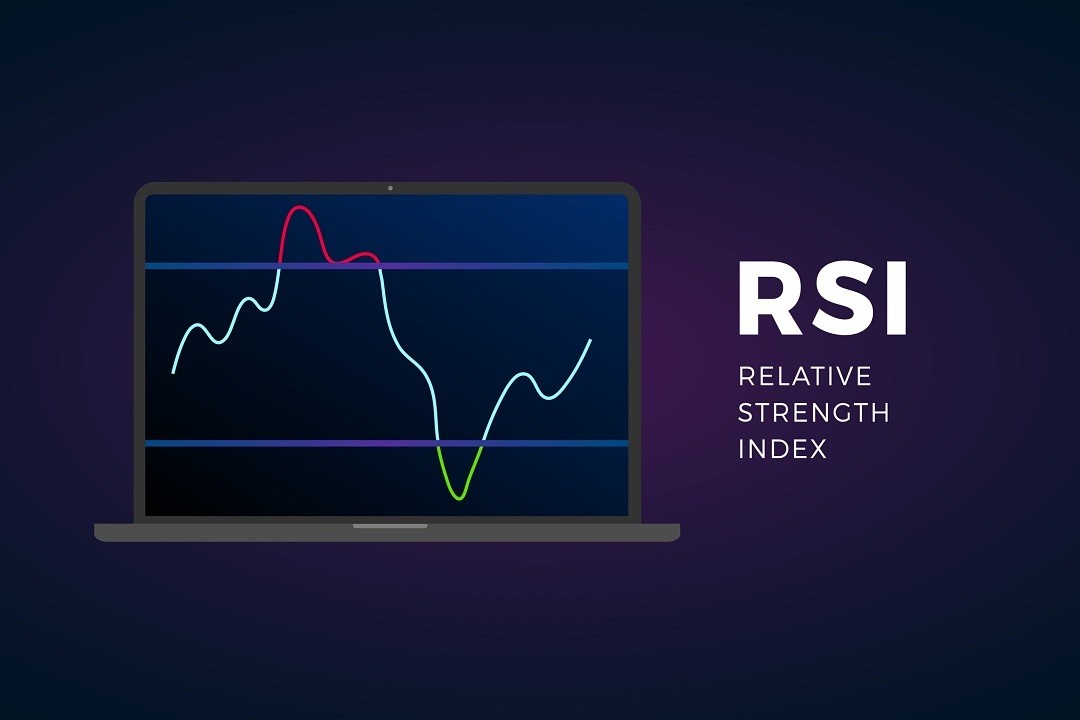
The RSI is an oscillator, displayed as a line graph ranging from 0 to 100, that measures the momentum of price movements.
- Overbought Condition: RSI readings above 70 typically suggest that a security may be overbought and due for a correction or pullback.
- Oversold Condition: RSI readings below 30 often indicate oversold conditions, suggesting a potential price rebound.
These signals can help traders make buy or sell decisions. However, the RSI works best in range-bound markets and requires context when applied to trending securities.
How RSI Is Calculated
The RSI calculation involves two main steps:
- Step One: Calculate the initial RSI value:

The average gain or loss considers the percentage price changes over a look-back period (commonly 14 periods). Gains are summed and averaged for up days, while losses are summed and averaged for down days.
- Step Two: Smooth the results with subsequent calculations to ensure RSI approaches 0 or 100 only in strongly trending markets.
Once plotted, the RSI line rises with increasing gains and falls with rising losses, helping traders visualize momentum shifts.
Using RSI in Trading
1. Identifying Overbought and Oversold Levels
The most common application of RSI is identifying overbought (above 70) and oversold (below 30) levels. Traders often interpret these conditions as signals to sell or buy, respectively.
2. Recognizing Divergences
RSI divergences occur when price movements and RSI trends differ:
- Bullish Divergence: The price makes lower lows, but RSI makes higher lows, signaling rising bullish momentum.
- Bearish Divergence: The price makes higher highs, but RSI forms lower highs, suggesting weakening upward momentum.
3. Trend Confirmation
In trending markets, RSI readings often stay within certain ranges:
- During an uptrend, RSI typically remains above 30 and frequently approaches 70.
- In a downtrend, RSI tends to stay below 70 and frequently approaches 30.
Adapting RSI levels to align with prevailing trends helps avoid false signals.
Advanced RSI Techniques
1. Swing Rejections
A swing rejection occurs when RSI reverses within oversold or overbought territory:
- Bullish Swing Rejection: RSI falls into oversold territory, rises above 30, dips without falling back below 30, and breaks its previous high.
- Bearish Swing Rejection: RSI rises into overbought territory, falls below 70, peaks without exceeding 70, and breaks its previous low.
These patterns provide traders with actionable buy or sell signals.
2. Positive and Negative Reversals
Reversals involve contrasting movements in RSI and price:
- Positive Reversal: RSI makes a lower low while price forms a higher low, signaling potential upward momentum.
- Negative Reversal: RSI makes a higher high while price forms a lower high, indicating potential downward momentum.
RSI vs. MACD
While RSI measures the speed and change of price movements, the Moving Average Convergence Divergence (MACD) compares two moving averages to identify trend direction.
- RSI: Focuses on momentum and identifies overbought/oversold conditions.
- MACD: Highlights shifts in trend strength and direction.
Combining RSI and MACD can provide a comprehensive view of momentum and trend changes, helping traders refine their strategies.
Limitations of RSI
While RSI is a powerful tool, it has its constraints:
- False Signals: In strong trends, RSI can stay overbought or oversold for extended periods.
- Subjectivity: Interpretation varies depending on the security, time frame, and market conditions.
- Trending Markets: RSI is more reliable in range-bound markets and may generate misleading signals in trending markets.
How to Optimize RSI Use
To maximize RSI’s utility:
- Adjust Time Frames: Shorter periods (e.g., 5–9) make RSI more sensitive, suitable for day traders, while longer periods (e.g., 21–30) suit long-term investors.
- Blend with Other Indicators: Combine RSI with moving averages, support and resistance levels, or MACD for better validation.
- Adapt Levels to Trends: Adjust RSI thresholds based on market conditions to reduce false signals.
Conclusion
The RSI is a versatile and widely used tool for gauging momentum, identifying potential reversals, and validating trends. While it has limitations, combining RSI with other technical indicators and adapting it to prevailing market conditions can enhance its reliability. Whether you’re a novice trader or an experienced investor, mastering the RSI can be a game-changer in your technical analysis toolkit.
Incorporate the RSI into your trading strategy to better navigate market movements, identify profitable opportunities, and sharpen your decision-making edge.
Get Started with your Stock Investments today with MINTALPHAA.
Get deeper insights into the crypto market’s weekly trends discussed on our Spotify podcast.